
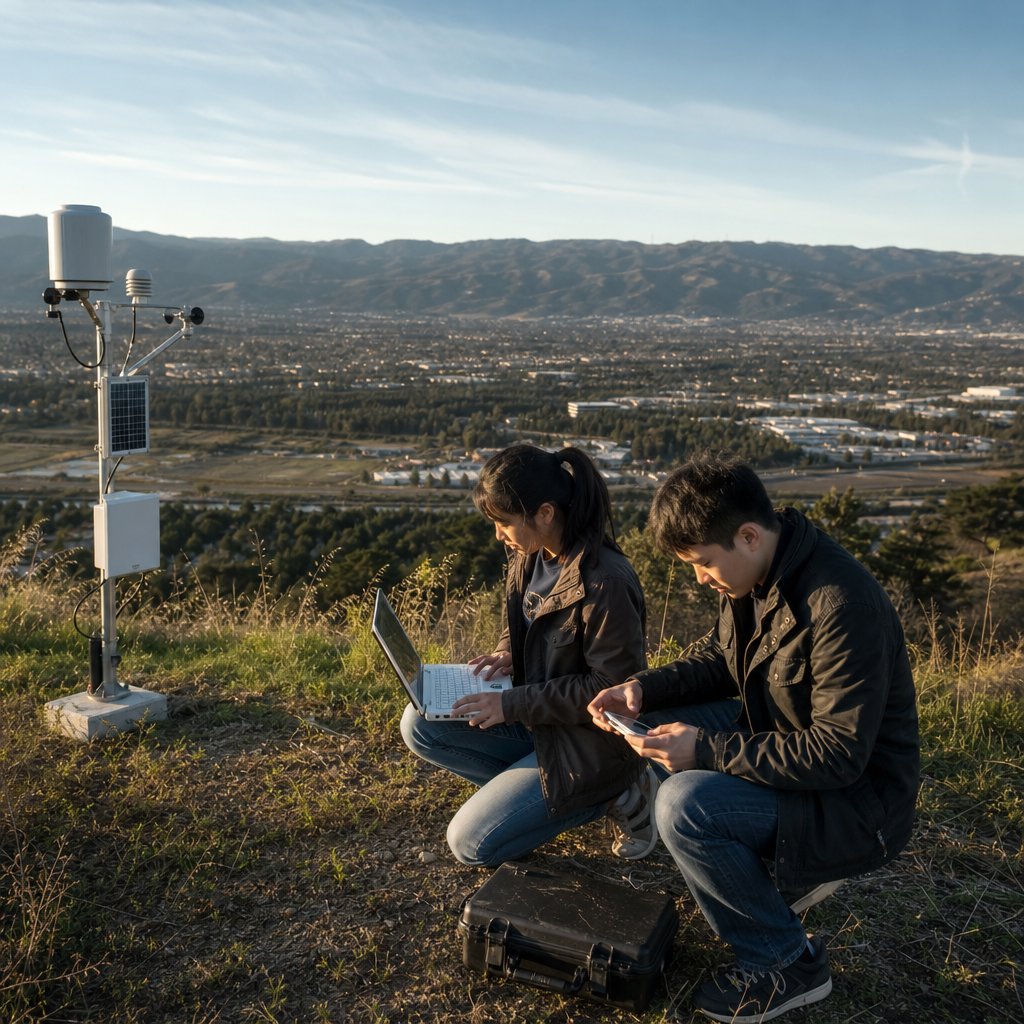
Tech-enabled environmental studies combine ecological science, data analytics, hardware design, and policy literacy to help students understand environmental change through direct measurement and modern interpretation. In Silicon Valley, this approach has moved far beyond textbook ecology. Schools, universities, nonprofits, and startups increasingly teach students to use sensors, geographic information systems, cloud dashboards, satellite imagery, and machine learning models to study air quality, water use, biodiversity, wildfire risk, and energy systems. The learning curve refers to the staged process of becoming competent with these tools and concepts, from basic observation and data collection to modeling, communication, and decision support. It matters because environmental problems are now monitored and managed through technology-rich systems, and learners need both scientific judgment and technical fluency to participate responsibly.
I have worked with student research teams using low-cost air monitors, ArcGIS story maps, and spreadsheet-based climate datasets, and the same pattern appears every time: enthusiasm is immediate, but mastery depends on sequencing. Students can collect readings on day one, yet interpreting calibration drift, spatial bias, or incomplete metadata takes guidance. Silicon Valley’s version of environmental studies is influential because it treats these challenges as part of the curriculum rather than as barriers. The region’s ecosystem of universities, makerspaces, venture-backed climate firms, and public agencies creates unusual access to tools and mentors. That environment supports a hub-style model of learning in which coding, fieldwork, ethics, and communication reinforce one another.
As a sub-pillar within educational resources, this learning curve topic serves as the central map for related articles on devices, software, projects, careers, and classroom methods. It helps readers answer practical questions: What should beginners learn first? Which tools are worth using? How much coding is necessary? Where do environmental science and engineering overlap? A strong answer requires clarity. Students do not need to become expert programmers before doing meaningful work, but they do need foundations in measurement, uncertainty, systems thinking, and evidence-based explanation. Silicon Valley’s most effective programs succeed because they make advanced methods approachable without pretending they are simple.
Why Silicon Valley became a model for tech-enabled environmental studies
Silicon Valley became a model because it concentrates three assets in one region: technical infrastructure, environmental urgency, and institutional collaboration. Technical infrastructure includes device prototyping labs, software talent, cloud platforms, and access to open-source communities. Environmental urgency is visible in drought cycles, heat waves, wildfire smoke, habitat fragmentation, and transportation emissions across the Bay Area. Institutional collaboration connects K–12 districts, Stanford, UC Berkeley partnerships, community colleges, municipal sustainability offices, and climate technology companies. When students can compare local creek measurements with satellite observations, then discuss findings with a planner or engineer, environmental studies stop being abstract.
Another reason this model stands out is its preference for project-based learning anchored in real datasets. Instead of limiting coursework to controlled laboratory exercises, many programs assign students to map tree canopy inequity, audit campus energy use, monitor particulate matter near roads, or analyze irrigation efficiency. These projects mirror professional workflows. Students define a question, choose instruments, collect data, clean files, validate assumptions, visualize results, and present recommendations. The tools vary, but the pattern is consistent. Platforms such as Google Earth Engine, QGIS, ArcGIS Online, iNaturalist, and Tableau frequently appear because they lower the barrier to meaningful analysis while preserving methodological rigor.
The learning curve: from observation to analysis
The learning curve in tech-enabled environmental studies is best understood as a progression through six competencies: environmental literacy, field measurement, data management, spatial analysis, modeling, and communication. Environmental literacy means understanding systems such as watersheds, carbon cycles, urban heat islands, and ecological succession. Field measurement adds instrument handling, sampling protocols, and safety. Data management includes file naming, timestamps, units, and metadata. Spatial analysis introduces mapping and location-based reasoning. Modeling covers scenario testing, forecasting, and pattern recognition. Communication turns technical findings into explanations that communities and decision-makers can use. If learners skip an early stage, later stages usually become shallow or error-prone.
| Stage | What Students Learn | Common Tools | Typical Mistake |
|---|---|---|---|
| Observation | Identify variables, habitats, and human impacts | Field journals, iNaturalist | Confusing anecdote with evidence |
| Measurement | Use sensors, probes, and sampling protocols | Vernier, PurpleAir, handheld GPS | Ignoring calibration and placement |
| Data Handling | Organize datasets and document metadata | Excel, Google Sheets, Airtable | Missing units or timestamps |
| Spatial Analysis | Interpret maps and geospatial patterns | QGIS, ArcGIS Online | Overstating correlation as causation |
| Modeling | Test scenarios and compare outcomes | Python, R, Earth Engine | Trusting outputs without assumptions review |
| Communication | Present results for public or policy use | Story maps, dashboards, reports | Using jargon that hides the takeaway |
In practice, beginners learn fastest when teachers compress complexity without removing reality. For example, I often start students with a one-week air quality project. They place sensors in three contrasting sites, compare PM2.5 levels, then investigate why readings differ by time, traffic, and wind. That single project introduces location bias, exposure pathways, and data cleaning. A more advanced class may add Python notebooks and EPA reference data, but the core learning goal remains the same: collect evidence carefully, then explain what it means and what it does not mean. This is the difference between tool usage and scientific understanding.
Core technologies and how students actually use them
Several technologies define Silicon Valley’s environmental studies workflow. Sensors measure temperature, humidity, particulate matter, soil moisture, dissolved oxygen, and noise. Drones capture aerial imagery for vegetation health, erosion, or habitat surveys, although they require flight rules and privacy awareness. Geographic information systems reveal spatial patterns and support layering of land use, elevation, traffic, heat, and demographic data. Remote sensing platforms use Landsat, Sentinel, and MODIS imagery to track change over time. Cloud-based dashboards help classes share results publicly. Machine learning appears later, often for classification tasks such as identifying land cover or predicting equipment failure in water systems.
Students use these technologies most effectively when each one answers a clear question. If the question is whether schoolyard shade inequity affects heat exposure, then thermal readings, tree canopy mapping, and student movement observations fit together. If the question is whether a creek is recovering after restoration, then turbidity, macroinvertebrate counts, and repeat photography may be more useful than a drone. In other words, the device should serve the inquiry, not dominate it. Programs that begin with expensive hardware often struggle. Programs that begin with a strong environmental question usually choose better tools and produce more credible findings.
One practical lesson from Silicon Valley classrooms is that low-cost does not mean low-value. A Raspberry Pi weather station, a calibrated particulate monitor, or a smartphone-enabled GPS survey can generate meaningful local insight when methods are disciplined. At the same time, instructors must teach limitations. Consumer sensors may drift, smartphone location can wander, and machine learning models inherit bias from training data. Strong programs do not hide those weaknesses. They make them part of the lesson by comparing low-cost tools with reference instruments, documenting uncertainty, and asking students to justify confidence levels before presenting conclusions.
Building curriculum around projects, partnerships, and careers
The most durable learning pathways are built around sequenced projects and external partnerships. A middle school unit might focus on campus waste audits and native habitat observation. High school students can progress to GIS mapping, water testing, or wildfire smoke analysis. Community college and university learners often add coding, statistical inference, environmental justice frameworks, and capstone research. Partnerships multiply the value of this progression. Utilities can share energy data, parks departments can host biodiversity surveys, and climate startups can provide mentors on battery storage, carbon accounting, or grid software. Students then see how environmental studies connects to actual jobs.
Career relevance is one reason this subtopic belongs at the center of educational resources. Tech-enabled environmental studies prepare learners for roles in sustainability analysis, environmental consulting, conservation technology, urban planning, geospatial analysis, clean energy operations, and public policy support. Not every student needs the same depth. Some will become field scientists who use digital tools lightly. Others will become data analysts who rarely collect samples themselves. The hub approach helps readers navigate that range. It should connect outward to focused articles on GIS skills, citizen science platforms, sensor selection, coding basics, internship pathways, and portfolio-building so learners can match interests with practical next steps.
Common obstacles and the smartest ways to overcome them
The biggest obstacles are usually not motivation but uneven access, overloaded teachers, and fragmented skill development. Devices cost money, software licensing can be confusing, and not every classroom has time for troubleshooting. Students also arrive with very different backgrounds in math, coding, and science writing. The best solution is scaffolding. Start with one environmental question, one reliable dataset, and one communication format. Use open tools where possible, such as QGIS, Python, and public satellite archives. Standardize templates for field notes and metadata. Build assessment around reasoning, not only polished visuals. A beautiful dashboard with weak methods teaches the wrong lesson.
Another obstacle is the temptation to oversimplify urgent issues. Wildfire, sea level rise, drought, and air pollution cannot be reduced to single-variable explanations. Educators should show students how multiple drivers interact: land management, infrastructure, weather, topography, policy, and behavior. That complexity is not discouraging when taught well. It is empowering because it reflects reality and creates room for better questions. The Silicon Valley approach works best when it combines optimism about innovation with discipline about evidence. Students should leave confident in their ability to investigate environmental problems, but equally aware that responsible interpretation requires patience, transparency, and revision.
Tech-enabled environmental studies give learners a practical way to understand the planet through evidence, systems thinking, and modern tools. Silicon Valley’s approach is valuable not because every school can copy its resources, but because its method is transferable: begin with real environmental questions, teach measurement carefully, build data skills in sequence, and connect classroom work to community needs. The learning curve is manageable when instruction moves from observation to analysis instead of jumping straight to advanced software. Readers using this hub should treat it as the starting point for deeper exploration of sensors, GIS, coding, project design, and careers. Choose one project, gather good data, and build from there.
Frequently Asked Questions
What does “tech-enabled environmental studies” mean in the context of Silicon Valley?
In Silicon Valley, tech-enabled environmental studies refers to the use of modern tools and digital systems to investigate environmental conditions in a more hands-on, data-rich way than traditional classroom ecology typically allows. Instead of learning only from diagrams, lab manuals, or static case studies, students collect real-world environmental data and analyze it using the same kinds of technologies used by researchers, public agencies, and climate-focused companies. This often includes low-cost air quality sensors, weather stations, GPS devices, drone imagery, geographic information systems (GIS), cloud-based data dashboards, satellite datasets, and machine learning models that help interpret patterns over time.
What makes the Silicon Valley approach distinct is its emphasis on applied problem-solving and interdisciplinary learning. Students are not just memorizing ecological concepts; they are connecting environmental science with coding, engineering, statistics, design thinking, and public policy. For example, a class studying air quality might deploy particulate matter sensors near roads, compare those readings to regional monitoring data, map results in GIS software, and then discuss how zoning, traffic, and public health policy influence what they found. This creates a stronger bridge between scientific observation and civic understanding.
The result is a learning model that feels current, practical, and deeply relevant. Students see environmental change as something measurable and interpretable, not abstract or distant. They also gain valuable technical literacy by working with tools that are increasingly important in sustainability careers, urban planning, environmental consulting, clean technology, and climate research.
How are students using sensors and data tools to study air quality?
Students use sensors and data tools to move from general awareness about pollution to direct investigation of what is happening in specific places and at specific times. In many Silicon Valley programs, students begin by learning how air quality is measured, including pollutants such as particulate matter, ozone, carbon dioxide, nitrogen oxides, and volatile organic compounds. They then use portable or fixed sensors to gather readings in neighborhoods, school zones, parks, transit corridors, or industrial-adjacent areas. This gives them firsthand experience with environmental monitoring rather than relying solely on official reports.
Once the data is collected, students typically upload it to cloud platforms or dashboards that display trends in charts, maps, and time series. They may compare readings from different locations, identify daily or seasonal fluctuations, and examine how weather conditions like wind, heat, and humidity affect measurements. With GIS tools, they can layer air quality data onto land-use maps, traffic density, tree cover, or census information to better understand environmental patterns and disparities. Satellite imagery and publicly available datasets often add another level of context, helping students compare local findings to regional pollution events such as wildfire smoke.
More advanced programs may introduce machine learning or statistical modeling to help students detect anomalies, classify pollution sources, or forecast short-term changes. Even when the models are simplified for educational use, the process teaches an important lesson: environmental data requires interpretation, validation, and context. Students learn that sensor readings can be influenced by calibration issues, placement, and environmental conditions, so part of the educational value lies in understanding data quality and scientific uncertainty. That combination of fieldwork, analysis, and critical thinking is a major reason this approach is so effective.
Why has Silicon Valley become a leader in technology-driven environmental education?
Silicon Valley has become a leader in this area because it sits at the intersection of technological innovation, academic research, entrepreneurial culture, and growing environmental urgency. The region has strong access to software talent, hardware development expertise, venture-backed startups, major universities, and nonprofit organizations focused on education and sustainability. That ecosystem makes it easier for schools and learning programs to experiment with sensor-based projects, cloud platforms, mapping applications, and data visualization tools that might be harder to adopt elsewhere.
Another key factor is mindset. Silicon Valley has long emphasized iteration, prototyping, and real-world problem-solving, and those habits translate naturally into environmental education. Instead of treating ecology as a purely theoretical subject, programs often frame it as a challenge that can be investigated, measured, and improved with the right combination of science and technology. Students are encouraged to ask practical questions such as where pollution hotspots occur, how local landscapes influence heat and air flow, or how community data can support better decision-making. This inquiry-based approach aligns well with both STEM education and environmental literacy.
The region also faces visible environmental pressures that make this work meaningful and immediate. Wildfire smoke, drought, urban heat, transportation emissions, and water management issues are not distant topics for many students; they are part of daily life. That immediacy creates motivation. When students use modern tools to study the air they breathe or the changing conditions in their own communities, the learning becomes more engaging and more actionable. Silicon Valley’s leadership, then, is not just about access to technology. It is about using that technology to connect education with real environmental conditions and future-focused civic responsibility.
What skills do students gain from tech-enabled environmental studies?
Students gain a broad mix of scientific, technical, analytical, and communication skills. On the scientific side, they learn how to form hypotheses, design sampling strategies, collect field measurements, document methods, and interpret evidence. They also build a stronger understanding of ecological systems, atmospheric processes, pollution sources, land-use impacts, and the relationship between environmental conditions and human health. Because the work is rooted in measurement and observation, students often come away with a more practical understanding of how environmental science is actually conducted.
On the technical side, students develop experience with digital tools that are increasingly relevant across industries. They may learn sensor deployment, data logging, spreadsheet analysis, GIS mapping, dashboard creation, remote sensing basics, and introductory coding for cleaning or visualizing data. In more advanced settings, they might explore statistical models, automation workflows, or machine learning applications related to environmental forecasting or pattern detection. These are highly transferable skills that support future pathways in climate technology, engineering, urban planning, public health, geography, and environmental policy.
Just as important, students strengthen skills that employers and universities consistently value: critical thinking, teamwork, problem-solving, and communication. Environmental data rarely tells a complete story on its own, so students must evaluate uncertainty, question assumptions, and connect findings to social and policy contexts. Many projects require presenting results to classmates, community members, school leaders, or local organizations, which builds confidence in explaining technical information clearly. This combination of scientific literacy and practical communication is one of the strongest outcomes of the Silicon Valley model.
How does this approach prepare students for future careers and civic engagement?
Tech-enabled environmental studies prepares students for future careers by exposing them early to the tools, workflows, and interdisciplinary thinking now shaping sustainability-related professions. Today’s environmental work rarely happens in isolation. It often involves collaboration among scientists, software developers, engineers, data analysts, designers, and policymakers. By learning to gather environmental measurements, analyze datasets, map patterns, and communicate implications, students begin building the exact cross-functional mindset needed in fields such as environmental science, renewable energy, climate technology, smart cities, conservation, environmental justice, and public health.
This approach also gives students something many traditional models do not: experience with applied evidence. Employers and higher education programs increasingly value candidates who can work with real data, understand digital systems, and solve messy, real-world problems. A student who has monitored neighborhood air quality, built a GIS map of pollution patterns, and presented findings to a local audience has done more than complete a classroom assignment. That student has practiced investigation, interpretation, and stakeholder communication in a way that closely resembles professional environmental work.
Beyond career readiness, this model supports meaningful civic engagement. When students understand how environmental conditions are measured and how data can inform community decisions, they are better equipped to participate in public conversations about land use, transportation, air quality, climate resilience, and environmental equity. They learn that data is not just a technical resource; it can also be a public-interest tool that helps communities identify problems and advocate for solutions. In that sense, Silicon Valley’s approach is not simply preparing students for jobs. It is preparing them to be informed contributors to environmental decision-making in a rapidly changing world.